How to Trade Different Types of Trendlines in Forex?
By EoneFX Insights
24 October 2025
Trendlines are one of the simplest yet most powerful tools in forex trading in UAE. They help traders identify the direction of the market, spot potential entry and exit points, and make more informed decisions. By connecting price highs or lows on a chart, trendlines reveal whether the market is moving upward, downward, or sideways.
But not all trendlines are the same, there are different types, and each has its own role in understanding market behavior. In this blog, we’ll explore how to trade using different types of trendlines in forex, so you can use them effectively in your strategy and improve your chances of success.
What is Trend Trading?
Trend trading is one of the most popular approaches in the forex market because it focuses on aligning trades with the prevailing direction of price movement. Simply put, a trend occurs when the price of a currency pair moves consistently in one direction—either upward (an uptrend) or downward (a downtrend), for a certain period. The main goal of trend trading is to capitalize on these sustained movements rather than predicting short-term fluctuations.
Unlike scalping or day trading, which rely on rapid entries and exits, trend trading emphasizes identifying the dominant market direction and holding positions accordingly. For example, if EUR/USD shows a strong bullish momentum, a trend trader might look for opportunities to go long rather than short, aiming to ride the wave until signs of reversal appear.
Why Do Traders Prefer Trend Trading?
The appeal of trend trading lies in its logical foundation: “the trend is your friend.” Markets often exhibit phases where prices follow a clear path influenced by economic indicators, geopolitical events, and investor sentiment. These phases can last from minutes to weeks, giving traders enough time to analyze and act.
Many traders choose this strategy because:
- Predictability: Trends tend to sustain over time, providing better risk-to-reward ratios.
- Flexibility: Trend trading works across multiple time frames, whether you are a short-term or long-term trader.
- Integration with Indicators: It pairs well with technical tools such as moving averages, MACD, RSI, and trend lines for confirmation.
What is a Trend Line, and How to Identify It?
A trend line is one of the most fundamental tools in technical analysis, yet it often gets overlooked by new traders who jump straight into complex indicators. Simply put, a trend line is a line drawn on a price chart to highlight the direction of the market over a certain period. It connects at least two significant price points and extends into the future to act as a dynamic support or resistance level.
Unlike static levels that remain fixed, a trend line evolves as the market moves. This makes it highly valuable for traders using strategies like trend following or breakout trading, whether they are working with a best online forex broker or any online forex trading broker platform.
Why Are Trend Lines Important?
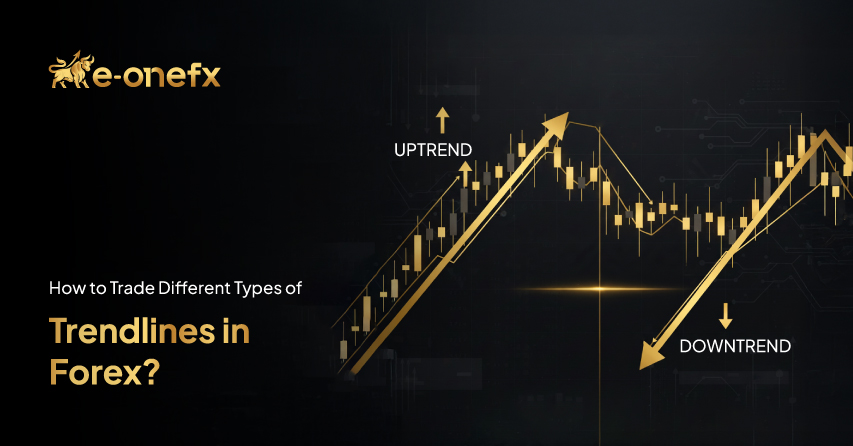
Trend lines visually tell you whether the market is in an uptrend, a downtrend, or consolidating sideways. They help you answer the most important question before entering a trade: “Am I trading with the trend or against it?”
- An uptrend line is drawn by connecting at least two higher lows on the price chart. It slopes upward, showing that buyers are in control and the market is making consistent progress.
- A downtrend line is formed by linking two or more lower highs, sloping downward, which means sellers dominate and prices are generally declining.
For example, consider a currency pair like EUR/USD. If it consistently makes higher highs and higher lows, a trend line drawn below the lows will help identify strong buying zones. On the other hand, if the pair forms lower highs and lower lows, the trend line above the price will signal potential resistance.
The Different Types of Trends Nobody Tells You
Most traders only focus on whether the market is in an uptrend or downtrend. But here’s the truth: not all trends are created equal. The strength of a trend is just as important as its direction because it tells you how reliable the move is and whether it’s worth trading. Broadly, trends can be divided into three types, strong trends, healthy trends, and weak trends. Let’s explore each in detail:
1. Strong Trend
A strong trend is when the market moves in one direction with little to no hesitation. In an uptrend, prices keep making higher highs and higher lows with almost no deep pullbacks. In a downtrend, it’s the opposite, lower lows and lower highs dominate.
- How it looks on the chart: Candles are large, continuous, and mostly in one direction. Pullbacks are shallow or almost nonexistent.
- Why it matters: Strong trends often happen during big news releases, major economic events, or when institutions are driving the market.
- How to trade it: Traders usually enter quickly and ride the momentum. However, these trends can reverse sharply, so stop-loss orders are essential.
Example: If EUR/USD rallies sharply after a central bank decision, moving up with very few pauses, that’s a strong trend.
2. Healthy Trend
A healthy trend is the most sustainable type. Prices move in one direction but with regular pullbacks or corrections. These pullbacks act like “pauses,” giving the trend room to continue without burning out too quickly.
- How it looks on the chart: In an uptrend, you’ll see a steady rise with occasional dips. In a downtrend, the market drops but with short upward corrections.
- Why it matters: Healthy trends are more reliable and give traders opportunities to enter during the pullbacks instead of chasing the price.
- How to trade it: Many traders wait for these small pullbacks and use support/resistance or trendlines to find safe entry points.
Example: GBP/USD steadily climbing over several weeks, but with small dips along the way where traders can re-enter.
3. Weak Trend
A weak trend shows very little commitment from buyers or sellers. The market may still be moving upward or downward, but the direction isn’t clear or strong. Prices often move sideways, or pullbacks are deep enough to nearly cancel the trend.
- How it looks on the chart: Small candles, choppy movement, and no clear higher highs/lows or lower lows/highs.
- Why it matters: Weak trends are risky because they can easily reverse or turn into sideways markets. Many traders get trapped here if they expect a strong continuation.
- How to trade it: It’s often better to avoid trading weak trends unless you’re experienced with range-bound strategies. Using tight risk management is crucial.
Example: USD/JPY drifting slightly upwards but constantly bouncing back, making it hard to decide whether the trend will continue.
What are the Different Types of Trends?
Before we dive into drawing and trading with trendlines, it’s important to understand that not all market trends behave the same way. Some trends move sharply and aggressively in one direction, leaving little room for pullbacks. Others develop more slowly, showing regular pauses or corrections before continuing. And then there are weak or uncertain trends, where the market moves sideways or struggles to maintain momentum.
This variation is exactly why traders need to first identify the type of trend before deciding how to trade it. A strategy that works in a strong trend may fail in a weak or sideways market.
Among the tools used to analyze these movements, straight trendlines remain one of the most reliable. They help traders make sense of price action, offering clear reference points for potential entries, exits, or stop-loss placements. But to use them effectively, it’s crucial to know when a straight trendline is valid and what market conditions make it powerful.
When is a Straight Trendline Valid?
A straight trendline is considered valid when it connects two or more significant swing points, either swing highs in a downtrend or swing lows in an uptrend, forming a consistent slope. The strength of a trendline grows with each additional touch that does not break through it.
For example, imagine EUR/USD moving in an uptrend. Every time the price dips, it pulls back to the same rising trendline and bounces higher. If this happens three or more times, it shows that traders across the market are respecting this level. The repeated “respect” acts as confirmation, signaling that the trendline is reliable and can be used for trade entries or exits.
The key is consistency. If the price frequently cuts through the trendline without respecting it, the line loses reliability. At this stage, traders may need to switch to other tools like curved or parabolic trendlines, which better capture market behavior when momentum shifts.
What Market Condition is a Straight Trendline’s Biggest Strength?
Straight trendlines work best in healthy, directional markets, where prices move steadily with clear pullbacks. These conditions provide the perfect balance between momentum and correction, giving trendlines the chance to act as reliable guides.
In such environments, trendlines serve as dynamic support or resistance levels, offering predictable points where traders can make decisions.
- In an uptrend: Traders watch for bounce setups. When the price dips to the trendline and holds, it signals a potential continuation upward.
- In a downtrend: The price rallies back to the trendline before resuming its decline, creating short-selling opportunities.
However, in volatile or range-bound markets, straight trendlines lose their effectiveness. Prices may cut through them repeatedly, creating false signals. In these situations, it’s safer to combine trendlines with technical indicators such as RSI (Relative Strength Index) or MACD (Moving Average Convergence Divergence) to filter out noise and validate trade setups.
What Are The Types of Trend Trading Strategies?
Trend trading strategies are designed to help traders identify the market’s direction and take trades that align with that direction. Since markets often move in trends, either upward, downward, or sideways, using the right tools can make trend-following much easier. Among the most popular methods are technical indicators that confirm trend strength, momentum, or potential reversal points. Let’s break down some of the most widely used strategies:
1. The MACD Trading Indicator (Moving Average Convergence Divergence)
The MACD is one of the most trusted tools for identifying both the direction of a trend and possible momentum shifts. It uses two moving averages, the MACD line and the Signal line—along with a histogram that shows the difference between them.
How it works:
- When the MACD line crosses above the Signal line, it often signals the start of an uptrend.
- When the MACD line crosses below the Signal line, it suggests a downtrend may be starting.
- The histogram also gives visual cues: longer bars mean stronger momentum, while shrinking bars can warn of a weakening trend.
Why traders use it:
MACD helps spot not only the trend but also potential entry and exit points. For example, in a strong EUR/USD rally, traders may wait for a bullish crossover before entering long trades, ensuring they move with the momentum rather than against it.
2. The RSI Trading Indicator (Relative Strength Index)
The RSI is a momentum oscillator that measures how quickly prices are moving relative to past performance. It gives traders a reading between 0 and 100, helping to identify whether a currency pair is overbought or oversold.
How it works:
- An RSI reading above 70 often indicates the market is overbought, meaning a reversal or pullback could happen.
- An RSI reading below 30 suggests the market is oversold, signaling a possible bounce or uptrend continuation.
- Readings between 40–60 often indicate a healthy trend without extreme conditions.
Why traders use it:
RSI works best when combined with trendlines or other indicators. For example, in a healthy uptrend, traders might ignore overbought signals above 70 and instead look for pullbacks when RSI dips to 40–50 before bouncing again. This avoids premature exits in strong markets.
3. The ADX Indicator (Average Directional Index)
The ADX is a powerful tool for measuring the strength of a trend rather than its direction. It ranges from 0 to 100, where higher values indicate stronger trends.
How it works:
- ADX below 20 suggests a weak or sideways market with no clear trend.
- ADX between 20–40 indicates a developing or moderately strong trend.
- ADX above 40 shows a very strong trend, where following the trend is often more profitable than betting against it.
Why traders use it:
ADX helps traders decide whether they should use trend-following strategies or switch to range-bound strategies. For example, if ADX is low, placing trendline trades may not work well. But when ADX climbs above 30, traders know the market is trending strongly, making trendline bounces or moving average strategies more reliable.
How to Profit from the Different Types of Trend Lines
Trendlines are one of the most powerful tools in technical analysis, but their effectiveness depends on how you use them. Whether it’s a straight trendline, a curved one, or a reversal trendline, each has its own characteristics that can help you spot profitable opportunities in forex trading. Below are practical strategies to make the most out of each trendline type.
1. Straight Trend Line
The straight trendline is the foundation of trend trading. It connects two or more price points to define the direction of the market—either bullish or bearish. The key here is precision.
How to trade with a straight trendline:
- Follow the trend: In an uptrend, look to enter buy trades near the trendline support. Place your stop-loss just below the trendline to minimize risk. For a downtrend, do the opposite, enter short positions near the resistance level with a stop-loss slightly above it.
- Combine with price action: Don’t rely on the trendline alone. Wait for confirmation signals like bullish engulfing patterns or hammer candlesticks for buy trades, and shooting stars or bearish engulfing patterns for sell trades. This increases the accuracy of your entries.
- Use trendline breaks cautiously: If the price closes below a rising trendline (or above a falling one), it can signal a reversal. But confirm this with trading volume or a momentum indicator like MACD to avoid false signals.
Example: Suppose EUR/USD is forming higher lows on the 1-hour chart. A straight trendline drawn below these lows acts as a strong support level. If price pulls back and forms a bullish pin bar at this line, it could be your entry trigger.
2. Curved Trend Line
Unlike straight trendlines, curved trendlines follow a parabolic movement. These curves usually indicate strong momentum in the beginning, but as the curve steepens, the trend often becomes unsustainable.
How to trade a curved trendline effectively:
- Spot the curve early: If price action accelerates sharply and begins to curve upward (or downward), draw a parabolic trendline. This usually happens in aggressive bull or bear markets.
- Prepare for a potential reversal: The steeper the curve, the more likely it is to break. A break below a parabolic trendline in an uptrend often signals the beginning of a major correction.
- Combine with momentum indicators: Indicators like RSI or the Stochastic Oscillator work well here. For example, if RSI is showing overbought conditions while the price hugs a steep curved line, it’s a warning sign of a reversal.
Example: Imagine GBP/USD surges in a near-vertical move, forming a parabolic curve. If RSI hits 80 and the price fails to make new highs, it could be the ideal time to prepare for a sell setup once the curved trendline breaks.
3. Reversal Trend Line
A reversal trendline strategy focuses on breakouts and retests, which often signal major trend changes. These setups can be highly rewarding when executed correctly.
Steps to trade reversal trendlines:
- Wait for a clean break: When the price convincingly breaks through a strong trendline that has held for a long time, it’s the first clue of a possible reversal.
- Look for a retest: Instead of entering immediately after the break, wait for the price to retest the broken trendline. This line now acts as a new support or resistance level. A successful retest is often a high-probability entry point.
- Add confirmation tools: Look for increased volume during the breakout or confirmation from indicators like MACD or ADX. This reduces the chance of falling into a false breakout trap.
Example: If USD/JPY has been in a steady uptrend and the price finally breaks below the main trendline with strong selling pressure, you should wait for a pullback to that same trendline before entering short. Combine this with an ADX reading above 25 for confirmation of trend strength.
Conclusion
Mastering trendlines in forex is more than just connecting dots on a chart—it’s about interpreting price action and understanding the psychology of the market. Straight trendlines allow you to ride the direction of the trend, curved lines give early warnings of possible slowdowns, and reversal trendlines highlight when the market is ready for a major shift.
However, the real strength of trend trading lies in confirmation. No professional trader relies on a single tool. Combining trendlines with reliable indicators such as MACD, RSI, or ADX gives you a clearer picture and reduces the risk of false signals. This layered approach ensures that your decisions are based on both price movement and momentum.
Execution also plays a huge role. Even the best analysis can fail if your broker cannot provide smooth order execution, fair spreads, and minimal slippage. That’s why partnering with a trusted platform like
E-one FX can make a big difference in your trading journey.
In the end, think of trendlines as your trading roadmap. With patience, discipline, and the right tools, they can guide you toward more consistent profits in the ever-changing world of forex.

Author:
EoneFX Insights
Dive into EoneFX Insights, your ultimate hub for expert market analysis, trading tips, and industry updates. From forex strategies to platform guidance, this blog equips traders with the tools and insights they need to succeed in dynamic markets. Stay informed and elevate your trading game with actionable content tailored for both beginners and professionals.