16 Candlestick Patterns Every Forex Trader Should know
By efx_admin
28 January 2025
Candlestick patterns are essential tools for forex trading to analyze price movement. Here are 16 key candlestick patterns you need to know to spot potential trading opportunities and make informed decisions.
What is a Candlestick?

A candlestick is a visual tool in forex trading that shows the price movement of an asset over a specific time period. It’s like a snapshot of how prices are changing, making it easier for traders to analyze and make decisions. Candlestick charts are widely used in trading because they quickly show key price information.
Each candlestick has three main parts:
- The Body: This shows the range between the opening and closing prices.
- The Wick (or Shadow): These are the lines above and below the body, showing the highest and lowest prices during the time period.
- The Color: A green or white candlestick means the price went up, while a red or black candlestick means the price went down.
Candlesticks also form patterns over time, which traders use to identify trends, support and resistance levels, or even market indecision. These patterns can reveal if buyers or sellers are in control and help predict future price movements. The following blog will help you understand What is the candlestick patterns in forex in detail.
Six Bullish Candlestick Patterns
Bullish candlestick patterns are chart formations that signal a potential upward trend in the market. These patterns are crucial for traders to identify turning points and capitalize on profitable opportunities.
Let’s explore six of the most common bullish candlestick patterns with detailed explanations that will help you start forex trading.
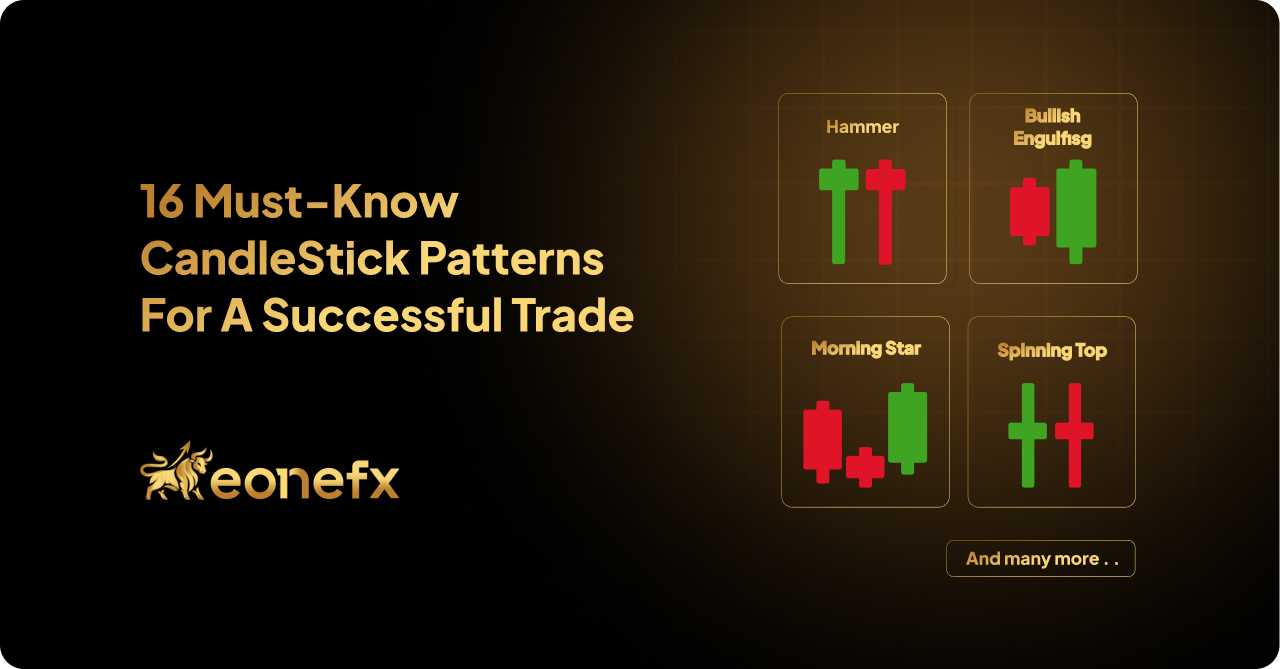
1. Hammer
A hammer is a single candlestick pattern that suggests a possible rise in price after a downtrend. It has a small body at the top and a long lower wick, looking like a hammer. The long wick means sellers pushed the price lower, but buyers fought back and pushed it higher.
If the hammer is green, it shows stronger buying pressure. For it to be a true hammer, the wick should be at least twice the length of the body. Traders usually wait for a bullish candle after the hammer to confirm the change.

2. Inverse Hammer
An inverse hammer is the opposite of the hammer and signals a possible upward price movement. It has a small body at the bottom, a long upper wick, and little to no lower wick. The long upper wick means buyers tried to push the price higher, but sellers resisted.
However, when sellers fail to keep the price down, it shows that buyers may be taking control. Like the hammer, the inverse hammer is more reliable if followed by a bullish candle.

3. Bullish Engulfing
A bullish engulfing is made of two candles and shows a strong price rise ahead. The first candle is bearish (falling), and the second is bullish (rising), completely covering the first one. This shows that buyers suddenly became much stronger than sellers.
This pattern is common at the end of a downtrend when buyers push the price up. It’s even more powerful if it happens at a support level or after a long downtrend.

4. Piercing Line
A piercing line is a two-candle pattern showing a possible price rise in forex trading. It starts with a bearish candle, followed by a bullish one. The bullish candle opens lower than the previous close but closes above its middle.
The first candle shows selling, but the second shows buyers coming in and taking control. It’s a weaker reversal than the bullish engulfing but still suggests a change in market direction. However, a better understanding of What is the candlestick patterns in forex will help you to Start forex trading on an informative trader note.

5. Morning Star
A morning star is a three-candle pattern that signals a possible price rise. The first candle is bearish (falling), the second is small (showing indecision), and the third is strong and bullish (rising).
This pattern shows that sellers are losing control and buyers are taking over. It’s more reliable when it forms near a support level.

6. Three White Soldiers
The three white soldiers pattern is made up of three bullish candles that signal a strong price rise in forex trading. Each candle closes higher than the last one. The first candle is usually within the range of the last bearish candle, and the next two candles show increasing buying pressure.
This pattern shows that buyers are clearly in control and often appears after a long downtrend. Each candle in this pattern should have a long body with little wick, showing steady upward movement.

Ready to Trade? Open a Live Forex Trading Account in Mauritius Today and Master These Candlestick Patterns!
Six Bearish Candlestick Patterns
Bearish candlestick patterns are chart formations that signal a potential downward trend in the market. These patterns are essential for traders to recognize potential market reversals and take appropriate action. Let’s explore six common bearish candlestick patterns in detail to start forex trading.
1. Hanging Man
The hanging man is a single candlestick pattern that signals a possible bearish reversal at the end of an uptrend.
This pattern has a small body near the top of the candle and a long lower shadow, resembling a hanging figure. The long shadow shows that sellers pushed prices lower during the session, but buyers managed to bring the price back near the opening. Despite the recovery, the presence of this pattern indicates that selling pressure is growing and the uptrend may soon reverse.

2. Shooting Star
A shooting star is a bearish reversal pattern that appears after an uptrend and resembles an inverted hammer.
This single candle has a small body at the bottom and a long upper shadow. It indicates that the market tried to push higher but failed to maintain the upward momentum, closing near the opening price. The shooting star is considered a strong sign of weakening buyer control, especially when confirmed by a bearish candle following it.

3. Bearish Engulfing
A bearish engulfing pattern consists of two candles and signals a potential downward reversal.
The first candle is bullish with a small body, and the second is bearish, completely engulfing the body of the first candle. This pattern indicates that sellers have taken control, overwhelming the buyers and pushing prices lower. The stronger the second candle’s downward movement, the more reliable the bearish engulfing pattern is as a reversal signal.

4. Evening Star
An evening star is a three-candle pattern that indicates a bearish reversal after an uptrend.
It starts with a long bullish candle in forex trading, followed by a small-bodied candle (a doji or spinning top), and ends with a strong bearish candle that closes below the midpoint of the first candle. This formation shows that the uptrend is losing steam, indecision is setting in, and sellers are gaining dominance. The evening star is a strong bearish signal, particularly when it forms near a resistance level.

5. Three Black Crows
The three black crows pattern is a bearish reversal pattern consisting of three consecutive bearish candles.
Each candle opens within the previous candle’s body and closes lower, with minimal or no shadows. This formation indicates strong and consistent selling pressure, signaling the start of a downtrend. The three black crows are a highly reliable bearish signal when they appear after an extended uptrend or near a resistance zone.

6. Dark Cloud Cover
The dark cloud cover is a two-candlestick pattern that suggests a bearish reversal at the end of an uptrend.
The first candle is bullish, while the second opens above the first candle’s close but closes below its midpoint. This pattern indicates that the buying momentum has been overtaken by selling pressure, signaling a shift in market sentiment. Short shadows on the candles strengthen the signal, suggesting a strong downtrend is likely.

Four Continuation Candlestick Patterns
Continuation candlestick patterns typically signal a pause in the forex trading market rather than a reversal. These patterns indicate periods of indecision or consolidation, suggesting that the prevailing trend may resume after a temporary rest. Let’s explore the four most common continuation candlestick patterns in detail to start forex trading:
1. Doji
A Doji looks like a plus sign with a very small or no body and short lines (called wicks) on both sides. This means the price opened and closed at almost the same level, showing that buyers and sellers are fighting for control, but neither side is winning. A Doji shows the market is unsure, but if it appears with other candlesticks, it can help predict if the market will continue its trend or change direction.

2. Spinning Top
The Spinning Top pattern has candles with small bodies and equal-length wicks on both sides. It happens when both buyers and sellers try to push the price up or down, but neither succeeds, so the price ends up near where it started.
This pattern often happens after big price moves, showing that the market is taking a break. It could mean the current trend will continue, or it could signal a change in direction, especially if it appears at the top of an uptrend or the bottom of a downtrend.

3. Falling Three Methods
The Falling Three Methods pattern shows up during a downtrend and suggests the price will keep going lower. It starts with a long red (bearish) candle, followed by three smaller green (bullish) candles inside the range of the first red candle.
The pattern ends with another long red candle that pushes the price lower. This means buyers tried to push the price up but didn’t have enough strength, so sellers took control again and continued the downtrend.

4. Rising Three Methods
The Rising Three Methods pattern is the opposite of the Falling Three Methods. It happens in an uptrend and shows the price is likely to continue going higher. It starts with a long green (bullish) candle, followed by three smaller red (bearish) candles inside the range of the first green candle. The pattern ends with another long green candle, showing that buyers are still in control and the uptrend will continue.

Practice Reading Candlestick Patterns
The best way to learn and become good at reading candlestick patterns in forex trading is by practicing entering and exiting trades based on the signals they provide.
This will help you get a better feel for how the market behaves in different situations and how candlestick patterns can predict market movements in forex trading in Mauritius.
At Eonefx, we support our traders in building their skills by offering a reliable platform with various tools for practicing and improving trading strategies.
FAQs
1. What is the most successful candlestick pattern?
The most successful candlestick pattern varies depending on the market context, but commonly used patterns like “Engulfing,” “Doji,” “Morning Star,” and “Hammer” are considered effective for predicting price trends when combined with other technical analysis tools.
2. What are the 42 candlestick patterns?
The 42 candlestick patterns in forex trading are specific combinations of price movements that traders use to predict market trends. These include both bullish and bearish patterns, such as “Hammer,” “Doji,” “Engulfing,” “Morning Star,” “Evening Star,” and “Shooting Star,” each indicating potential price movements.
3. Do professional traders use candlestick patterns?
Yes, professional traders use candlestick patterns as a part of their forex trading strategy to identify trends and market sentiment. However, they typically combine candlestick patterns in forex trading with other technical analysis methods, like moving averages and support/resistance levels, to make informed decisions.
4. What is the 5-candle rule?
The 5 candle rule is a trading strategy that uses a series of five consecutive candlesticks to analyze and predict price movements. It is commonly applied in patterns like the “Falling Three Methods” or “Rising Three Methods,” where traders look for a specific sequence of candles to confirm whether a trend is continuing or reversing.
Final Thoughts
Candlestick patterns are vital tools for Forex traders in Mauritius, helping to identify potential price movements and market sentiment. Whether spotting bullish signals like the Hammer or bearish ones like the Three Black Crows, mastering these patterns can significantly enhance your trading decisions.
However, the understanding of what is the candlestick patterns in forex is clear from this following structured blog.
With practice, you’ll become adept at reading these patterns, and using demo accounts can help you build confidence without risk. At Eonefx, we provide the tools and resources you need to improve your trading strategies and succeed in forex trading in Mauritius.

Author:
efx_admin
Dive into EoneFX Insights, your ultimate hub for expert market analysis, trading tips, and industry updates. From forex strategies to platform guidance, this blog equips traders with the tools and insights they need to succeed in dynamic markets. Stay informed and elevate your trading game with actionable content tailored for both beginners and professionals.